Article 6: The Basic Principles that Guide PV System Costs
By- Ranveer Yadav
Costs Associated with a PV
System
In order to determine
financial returns, it is important to have a solid understanding of the basic
economics that dictate PV system costs. There are two general categories of PV
systems costs: capital costs and operation and management (O&M) costs.
Capital Costs
Capital costs refer to
the fixed, one-time costs of designing and installing the system. Capital costs
are categorized into hard costs and soft costs.
Hard costs are the costs
of the equipment, including modules, inverters, and BOS components, as well as
installation-related labor. Soft costs include
intangible costs such as permitting, taxes, customer acquisition costs, etc.

Figure 1. Cost breakdown
of PV systems.
Figure 1 illustrates the
relationship between soft and hard costs, and breaks down hard costs into its
components. According to SEIA, while hard costs have come down dramatically
over the last decade, soft costs have remained largely constant.
Operation and Management Coats
O&M costs refer to
costs that are associated with running and maintaining the system. These can
include fuel, repairs, and operation personnel. PV systems generally have low
O&M costs.
Incentives and Policies
that Benefit Solar Energy
The high capital costs
are one of the biggest factors that discourage people from going solar. To
combat this, there are a number of incentives and policies in place to make PV systems financially
competitive.
Cost Bases Incentives
Cost based incentives,
such as the Solar Investment Tax Credit (ITC), allow those who invest in a
solar system to apply a tax credit towards their income tax. The incentive is
determined by the cost of the system, and is independent of its performance.
Performance based
incentives (PBIs)
Performance based
incentives (PBIs) encourage PV system owners to install and maintain efficient
systems through payments that are based on the monthly energy production of the
system.
Net Energy Metering
In addition to
incentives, many states, such as Delhi, implement a net energy metering (NEM) policy that allows consumers who generate excess
electricity to be reimbursed at the then-prevailing rate of electricity. For
instance, if a residential PV system produces an excess of 100 kWh over the
course of the month, the owner will be reimbursed for 100 kWh at the market
rate of electricity for that time period. The owner is then free to use that
reimbursement credit towards electricity they consume from the grid when solar
is not meeting their current energy load. Therefore, households with solar PV
and Electricity board are able to
significantly reduce their electricity bill.

Figure 2. Visualized relationship between PV
energy production and household electricity use for an average home
Figure 2 shows the
relationship between PV electricity production and electricity consumption
during the day. Note that while the PV system can generate more than enough
electricity during the daytime, it can fail to deliver electricity during peak
consumption hours.
Basic
Financial Calculation for a Residential PV System
In return for a large
upfront investment in a solar installation, homeowners that go solar benefit
from a reduced monthly electricity bill. Thus, for Electricity board regimes the benefit of solar comes in the form
of avoided costs.
For instance, assume
that upon installing a rooftop PV system, a home electricity bill is reduced by
INR1,500 per year and the cost of the hypothetical PV system is INR10,000 after
incentives. In order to calculate the simple payback period, which is the
approximate time for a PV system to pay for itself, we divide the cost of the
PV system by the savings.
Simple Payback Period=System
Cost/Annual Savings=INR10,000/INR1,500
Year=6.7years
Thus, the payback period
for a system that costs INR10,000 and reduces the electricity bill by INR1,500
per year is 6.7 years.
However, a PV system can
last much longer than the duration of its payback period. A typical rooftop PV
system has a lifetime of about 25 years. This means that for the last 18 years
of its life, after it has paid itself off, the hypothetical PV system described
above will generate revenue in the form of additional savings. To calculate
this revenue, we multiply the annual savings by the remaining lifetime of the
system, after it has paid itself off.
Net Revenue=Annual Savings×Years
left in lifetime after system is paid of
Net Revenue=Annual
Savings×Years left in lifetime after system is paid of
Net Revenue=INR1,500/year×18.3year=INR27,450Net
Revenue=INR1,500/year×18.3year=INR27,450
Based on this simple
analysis, the system will generate approximately INR27,450 in savings over its
lifetime. It is important to note that this is an approximation, and does not
take into account factors such as maintenance costs, changes in electricity
price and usage, as well as system degradation over time.
The figure below shows
another financial analysis for a hypothetical residential PV system. In both
graphs, the y-axis is the dollar amount and the x-axis is the year.
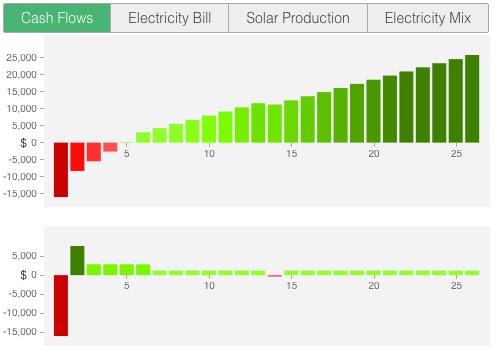
Figure 3. The cumulative
(top) and annual (bottom) cash flows of a hypothetical PV system.
The top graph, which
shows the cumulative cash flow of the project over time, and indicates that the
project has a payback period of approximately four years. Additionally, the
dollar amount in the 25th year, which is about $25,000, is the
cumulative net revenue that the system generated. The bottom graph is the
annual cash flow of the project. The first year is characterized by a large
negative cash flow, due to the large upfront cost required to install the
system, but after that there is positive annual cash flow with the exception to
this is in the 14th year, which is when the inverters are being replaced.


Comments
Post a Comment